11/13/2024

HireQuest HQI: Asset-Light Franchising, Strategic Acquisitions, And Profitable Growth


HireQuest (HQI)

Price = $14.48: Market Cap = 200.16M : Enterprise Value = 215.19M

P/B = 3.04: EV/Revenue = 5.80 : EV/EBITDA = 19.26


HireQuest (HQI) is a fast-growing national staffing franchisor with a proven, profitable asset-light model. It has impressive historical operating margins and strong free cash flow. The CEO’s net worth is invested in +22% of HQI’s outstanding shares. His total HQI investment is 44 million, and he often makes open market purchases.

The staffing industry is highly fragmented.  And HQI has aggressively made strategic acquisitions, buying smaller competitors and integrating them into its franchise model. Refranchising acquired companies boosts profits by lowering the capital requirements, costs, and operating risk.

Top-line growth is evident. Revenue per share increased by 126.22% from the 2021 balance of 1.15 to the trailing twelve-month balance of 2.61. Profitability has materially grown. Per share, retained earnings, and book value grew by 283.09% and 87.54%, respectively, from 2021 to the current trailing 12 months. These value-increasing attributes have significantly outperformed its stock price performance, offering a mean reversion opportunity in addition to expanding multiples and value from additional growth. HQI’s price per share declined -23.01 % from the year ending 2021 to the current price of $14.25, contrasted to the material per share value improvement in retained earnings, book value, revenues, and a forward dividend yield of 1.68%. HQI declared a .06 dividend for shareholders of record 12/2/24. 


See the table below for historical financial performance.


Relative valuation using the NAISC code 561311 (employment placement agencies) for 14 companies.

HQI has the highest EBITDA margins, 30.11%, versus the NAISC (561311) average of -12.37%. The second-highest EBITDA margin was KFY at 12%. Sixteen insider buying transactions over the prior 12 months for HQI versus a medium of zero or three companies with one or two small insider purchases. Institutional ownership is 12.10% for HQI versus the average 60% for NAISC(561311). HireQuest's CEO purchased 18,459 shares in the open market in 2024 for $230,603 at an average price of 12.49. HQI directors purchased 7,000 shares for $89,080 at an average price of 12.73 in 2024. Since 2019, HQI insiders bought 346,889 shares for $3,216,348 at an average price of $9.27, with zero insider selling. Operationally, HireQuest consistently outperforms its peers!


A brief review of the most recent earnings for Q3 2024.

Revenue growth for Q3 2024 slowed to 1.60% year over year to $9.4 million, and sequential revenue growth was 8.5% compared to the second quarter of 2024. Temporary staffing brands grew by 3.6%, their first year-over-year growth since early 2023. Due to significant reductions in workers' compensation expenses, down 67% from last year, SG&A expenses dropped by +15% from Q3 2023.

Executive recruiting and permanent placement are long-term opportunities, but demand has been low. Due to a market downturn, MRI Network assets acquired in 2022 were impaired by $6 million. With the impairment charge removed, adjusted net income increased to $2.8 million. Adjusted EBITDA rose to $4.9 million with a 52% margin.

The company completed two small acquisitions in Q3. Management is actively looking for more deals, mainly in commercial staffing.

HireQuest expects better performance in 2025 due to market stabilization and cost control. Staffing market stability and disciplined expense management keep management optimistic.


Risk:

Economic downturns can reduce staffing demand.

Integrating acquisitions, such as MRI, introduces short-term margin compression and operational challenges.


Opportunities:

Through franchising, HQI can enter diversified staffing verticals and grow.

They can boost margins by buying and converting to their proven asset-light business model.  

The expanded national network enhances HQI’s ability to secure large contracts.

Franchises make HQI resilient to economic downturns. Companies may prefer temporary staffing solutions to full-time hires.


Conclusion:
HQI investment is a long-term buy. HireQuest stands out in the staffing industry because it has a proven asset-light franchise model, an aggressive acquisition strategy, management talent, and material ownership in the common stock. The company has grown in key financial metrics and adapted to economic changes. Despite recent price underperformance, the company's impressive prior four-year profitable operations, solid balance sheet, cost controls, and disciplined approach to acquisitions present a compelling mean reversion and growth opportunity.

Long HQI

7/23/2024

Transforming agriculture with innovative seed technology: S&W Seed Company

S&W Seed (SANW) is a global agricultural business focusing on alfalfa, sorghum, pasture, and sunflower seeds. It develops proprietary products using plant breeding and molecular techniques and sells over 600 seed products. Cleaning and processing facilities are located in Texas, New South Wales, and South Australia. S&W seed products are sold in over 40 countries, and management expects to introduce 20 new products during 2024.

In June 2023, SANW hired Mark Herrmann as their CEO. With a remarkable 35 years of experience in the seed industry, including a significant tenure at Monsanto, Mark brings a wealth of knowledge and a fresh perspective to our team. His recent role as the CEO/Founder of ACUMEN and AgReliant Genetics further underscores his leadership capabilities and his potential to steer S&W Seed toward greater success.

CFO Vanessa Baughman joined SANW on 05/2023. She brings extensive seed industry experience and insight into seed industry finances. Her financial tenure was as CFO at AgReliant Genetics, the largest North American seed company, from January 2000 to January 2019, and as a finance executive at Monsanto Company.


 Initiatives and Financial Progress during Q3 2024 

Double Team's proprietary sorghum trait technology will be planted on over 10% of all acres in the United States during 2024, double the amount planted last year. This is a 77% to 115% increase compared to fiscal 2023. Over the next few years, a gradual adoption increase will occur, with a 25 percent market share goal by 2027. Double Team is one of the fastest growing seed traits on the market because of S&W's sorghum technology. Farmers are realizing the benefits of improved yield enhancement through grass control and crop grazing safety technologies. YTD margins were 29.2% compared to 23.2% last year. The advantages are evident with Double Team gross margins of ~ 60%. Further, SANW expects them to increase due to efficiency and stacking technologies. S&W is the key technology provider in sorghum.


Several initiatives were implemented to improve efficiency, increase inventory utilization, reduce product SKUs, and cut outsourcing costs. Further, a plan was introduced to reduce seed manufacturing costs and rationalize certain low-margin forage product lines.

International operations face several headwinds, especially in the Middle East, Northern Africa, and the MENA region. They've gotten worse since February.

The Double Team technology platform by S&W Seed  (SANW) improves profitability and productivity for sorghum grain farmers. Sorghum requires less water and energy than other crops like corn. The technology also helps farmers optimize their use of resources, leading to better profitability.


S&W Seed Company adopted a brand and licensing strategy to expand. They have signed licensing agreements with 15 independent seed companies, some of which offer Double Team under private labels.

Mexico, Brazil, Argentina, and Australia are some of S&W Seed Company's key international markets. The company plans to work with market leaders in these regions through license agreements, allowing it to carry and promote Double Team while paying royalties.

Within three years, the Double Team quickly gained market acceptance, capturing 10% of the U.S. sorghum market. This rapid adoption rate shows how valuable and practical the technology is for sorghum farmers. SANW is also working on DT2, which allows earlier weed spraying during the sorghum growth cycle. They also work on DT and Prussic Acid-Free (PAF) traits for weed control and livestock safety.

For fiscal 2024, adjusted EBITDA expectations are negative $6 million to $8 million. Despite the negative EBITDA expectation, the payments from Shell and Trigall are expected to cover operating cash needs for 2024. SANW received a $6 million payment from Shell in February 2024 and will receive a $1.4 million payment from Trigall. Beyond fiscal 2024, if growth continues in its sorghum portfolio and it achieves expense management initiatives, it will soon be near positive cash flow.


The table below provides additional quantitative value analysis.

Tangible BV is .53 per share versus the market's current price of .32.  P/TB = .60, EV/BV = 1.25, trading at historical lows. My enterprise value is calculated as market value + total liabilities less cash. EV/GP is 3.97, down from 13.73 for 06/2022. EV/Sales = .94, down from the 2021 value of 2.11. Debt per share is significant at 1.19 and slightly improved from 1.24 for 2023.

Properties owned: Warehouse ( Moore County, Texas); Processing facility/Warehouse (Lubbock County, Texas); Research farm (Keith, South Australia)


Opportunities: 

The new CEO and CFO have deep operational experience managing seed businesses and introducing new traits.

Management expects Double Team to be on over 10% of U.S. sorghum acres. Plus, licensing and partnerships for international growth.

A successful launch and growth of Double Team, DT Forage Sorghum, and Prussic Acid Free.

Investing in R&D to develop new traits and focus on non-GMO solutions. From 12/2019 to the MRQ, 30.23 million or .81 per share was spent on research and development for new products.

Material improvement and quickly expanding margins with Double Team sorghum. Management is focused on high-margin products. Quarter 3 2024 saw a 25% margin improvement over Q3 2023, with GM% of 23.56% versus 18.77%.

Partnership with Shell to develop Camelina for biofuels and explore strategic partnerships to diversify revenue.

Removing noncore programs and selling nonessential assets.


Risk

Geopolitical events, such as contract losses in the MENA region and supply constraints in Australia, negatively affected revenue and EBITDA guidance. 

Agriculture market conditions are unpredictable, and SANW lacks the liquidity to wait another two years. Working capital must be managed efficiently to cover operational needs and reduce liquidity risks. Material negative surprises will likely result in dilution or bankruptcy to pay debtors.


Conclusion:

S&W Seed has demonstrated impressive growth with Double Team and its future product pipeline. Strategic partnerships and focusing on high-margin products with low-cost partnerships and associated royalties offer value for investors willing to take on the risk.

Despite this, we cannot predict droughts, floods, geopolitical issues, or market acceptance of their current or future products. This, coupled with current debt, makes SANW a HIGH RISK investment.

However, given the current valuation and current and potential value of existing seed technology, I consider SANW a POSITIVE EXPECTED VALUE INVESTMENT. So, I'm buying SANW.


Long SANW (S&W Seed Company)

7/07/2024

Consumer Cyclicals: Kambi Group (KMBIF) is statistically cheap

Kambi provides sports betting technology worldwide. Over 40 operators on six continents are part of their partnership. From compliance to odds-compiling, Kambi offers a wide range of services through its in-house software platform. Over 1,000 employees work at eight global locations: Malta (headquarters), Australia, Copenhagen, the Philippines, Romania, Sweden, the UK, and the US. 

My analysis is only quantitative and needs more work. I'm not making a recommendation but instead for additional research if interested.

Over the past few years, Kambi has lost its three largest customers. Kindred, Penn Entertainment, and DraftKings have purchased or developed internal solutions. However, the current price may offer an opportunity. The market may have overestimated the risk of Kambi's customers sourcing their sportsbook technology.

.


Enterprise value per share is 8.89. That's a decline of 71.12% from 30.77 at the end of 2020. Retained earnings per share rose 200.20% over the same period, from the MRQ balance of 4.66 versus the 2020 balance of 1.46. Ratios also improved, EV/Rev = 1.40 (85.46% improvement from 2020), EV/GP = 1.42 (66.60% improvement from 2020), and EV/Retained earnings = 1.91 (76.51% improvement from the 2020 balance of 21.11).


Kambi offers barriers to entry and switching costs. With its current low valuations, it could be an acquisition candidate. 

Risks: Loss of customers when companies develop or buy existing companies with solutions. Changes in technology and government regulatory changes.


No Position: Kambi Group (KMBIF)

6/10/2024

Simple Screen: Discounted Real Estate, Share Buybacks, Debt Reduction, Transformation, Oversold

 JACK: Jack In The Box

Jack in the Box was founded in 1951 and operates and franchises fast food restaurants, Jack in the Box and Del Taco, throughout the U.S. The company is based in San Diego, California.

Jack in the Box is transforming from an asset-heavy and barely growing to a faster-growing, asset-light franchisor that is shareholder-friendly by monetizing real estate assets, dividends and improving its capital structure with share repurchases.

In addition to 189 restaurant-owned land locations, JACK owns its corporate headquarters in San Diego, California. The headquarters is 70,000 square feet and contains approximately four acres of undeveloped land. Its fair market value is around 40 million. Rent is earned at the land locations owned by JACK and used by the franchisee. 

IMO, at these prices, Jack in the Box stock is a weak intermediate-term buy and a stronger long-term buy. There's a high debt load, no obvious valuation discount to peers, and rising inflation for food and labor. Demand for fast food is weak, and the market is highly competitive.

Management is committed to maximizing shareholder value. Using the CF statement, over the past five quarters, debt payment was 91.73M, 45.60M was distributed as dividends, and 60.43M was spent on share repurchases.


Long JACK on 07/11/24

Click here to discover new ideas on 10,805 stocks listed in the USA exchanges for multiple countries. Use the filter on the right; if you want, export it to Excel for additional analysis.


5/05/2024

Expensify: A busted IPO to an undervalued SaaS Micro-Cap

Expensify (EXFY) develops and sells Software-as-a-Service (SaaS) solutions designed to simplify expense reporting, receipt tracking, global payments, and company card reconciliation. The platform streamlines the financial expense management workflows. Expensify's features include payment processing, invoicing, chat, document management, global reimbursements, budgeting, and email notifications. Employees can easily report payments and receipts, allowing finance departments to track, analyze, and manage budgets more effectively.

Why Expensify (EXFY)? Expensify is a broken October 2021 IPO. Financially strong and valued at 125M as a Software-as-a-Service (SaaS). It's down 96% from its first week high as an IPO. However, EXFY trades at an EV/Rev of .83 with an average of 719,000 2023 paid members and $1,116,296 revenue per employee. FCF is projected to be between 10 and 12 million in 2024. Further, a clear road map and focus on dominating the untapped, underserved VSB (very small business) market that uses email and Excel to manage expenses and documents. New Expensify created a moat around payments and documents with real-time chat in 2024. In 2023 and 2024, Steven Mclaughlin (Founder / CEO / Financial Technology Partners) purchased 11,341,889 shares above the current market price.


Year-end 2023 results:

The full-year 2023 financial results were reported on 02/2024. Revenue was 150.70 million, operating cash flow was 1.60 million, and FCF was 600,000. GAAP net loss was $41.7 million, non-GAAP net loss was $500,000, and adjusted EBITDA was 13.20 million. Adjusted EBITDA excludes stock compensation, depreciation/amortization, interest expense, and taxes.

Quarter 4 revenue was 32.2 million, average paid members was 719,000, net loss was 7.50 million, and adjusted EBITDA was 5.90 million. The fourth quarter demonstrated material improvement over Q3, driven by expense reductions. Cash used in operations was $500,000. Free cash flow was negative at $3.6 million, and net loss was $7.5 million. Non-GAAP net income was $3.1 million, and adjusted EBITDA was $5.9 million.

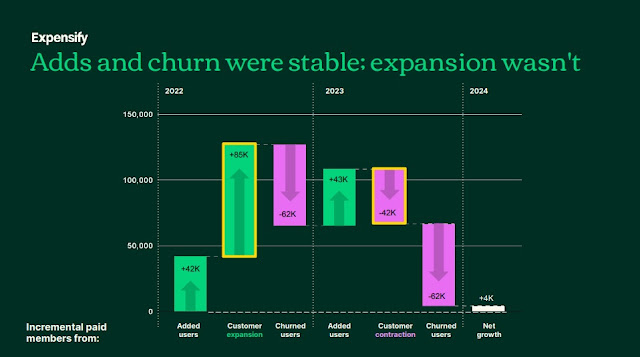
Adds, Churn, Expansion (FY 2022 and 2023)


The slide above was taken from Q4 2023 earnings call


Key metrics, like churn and new acquisitions, averaged the same over the prior two years. However, customer growth fluctuated materially, with a decline in paid seats compared to the previous year. The contraction of paid seats among existing customers resulted from challenging economic conditions reported by management. Despite economic conditions, customers stayed; instead, they made fewer and smaller transactions.


Opportunities:

EXFY is Software-as-a-Service (SaaS) with a positive and growing free cash flow. The enterprise-to-revenue ratio is .82, and the staggering average revenue per employee was 1,116,296 in 2023. The number of paid customers averaged 732,000 in 2023. And, if the top line and free cash flow exceed expectations, the stock price will quickly rise from its historical and relatively low EV/Rev of .83. Quarter four's 2023 free cash flow improvement does not fully reflect the new cost reduction to be realized in 2024.

Strong financial position: debt per share was reduced from a 2022 balance of .82 to .34 in the latest quarter. The company has a cash balance of 47.50 million and a remaining credit line of 22.70 million. Portland, Oregon, headquarters' 38,500-square-foot office space is owned.

David Barrett, the company's founder, has a strong background in technology. Previously, he was the engineering lead at Red Swoosh, a peer-to-peer file-sharing company acquired in 2007 by Akamai Technologies.

Expensify sold 9.73 million shares priced at $27 at its October 2021 IPO, raising $262.7 million. In its stock market debut, the stock opened at $39.75 and rose 47%, valuing the company at $3.87 billion.

The company is rolling out New Expensify and leaning into its core functionality by creating a moat using real-time chat within expense management, document exchange, global payments, and additional functionality around expense reimbursement. The newly added chat function is free of charge. However, plans will begin charging in 2024.

For 2024, management forecast 10-12 million in FCF without expecting an improved macro environment. The current cash balance is $48 million, with a small amount left on their revolving credit line. Share buybacks make sense, with a projected 10-12 million free cash flow in 2024. They have $41M remaining on their share buyback commitment but have no plans to repurchase shares.

Recruiting and focusing on accounting partners and onboarding clients onto the new card to enjoy 50 basis points in revenue share. The new card program enhances revenue by earning more interchange per transaction, with existing customers transitioning by the end of 2024. All new Expensify Card customers are automatically part of this program, increasing reported interchange fees by 20%, now reported as revenue and not a contra expense. 

New Expensify leans into real-time chat around every core function for document management, payments, and receipts. Chat is viral and makes AI a potentially more significant advantage. Chat surrounding each function offers a deeper understanding of what drives or destroys value.

Expense management can provide insight into business value drivers. Real-time chat around receipts/payments, documents, negotiations, travel management, payroll, and budgets will provide a deeper understanding of value creation or destruction. AI can be integrated into the analysis because AI is based on words (Chat). Conversations are attached to the file, report, task, or expense discussed. 


Management reported a +35% month-over-month increase in global reimbursement customers with the new Expensify.

Cost cutting was implemented halfway through the fourth quarter. So, the full impact will be realized in future quarters.

Expensify focuses on billions of untapped and uncontested global VSBs (very small businesses). There are 1.3B underserved users in the VSB/SMB market using spreadsheets and email. EXFY is the only company actively pursuing this huge, untapped market. According to management, there is no organized competition. The USA has 33.20 million small businesses, accounting for 99.9% of all US businesses. Expensify is built from the ground up for seamless interoperability.

The chat design around all New Expensify functions enables AI. A clear roadmap for Expensify's success centered around a viral, bottom-up, word-of-mouth lead generation strategy leveraged on chat.

With Expensify's SmartScan technology, you can take pictures of your receipts. To simplify expense tracking, it automatically reads the vendor, date, and amount. It integrates with accounting and ERP systems. The updated architecture is React Native. With it, you can get a synchronous layout and effects, a concurrent renderer.

Expensify was built internally but now uses open source. With thousands of talented developers worldwide, open-source leverages Expensify's internal engineering team.

Institutional Ownership is only 14.10%, with 66.53% of shares in public float.

Insider buying:

Steven J. McLaughlin, founder and CEO of FT Partners, a fintech-focused investment banking firm, has aggressively accumulated shares and is now a 10% owner. Starting in August 2023, McLaughlin purchased 1,659,105 shares for 8,262,909 at an average price of $4.98. In October 2023, an additional 168,894 shares were purchased for 418,857 at an average price of 2.48. In November 2023, 1,014197 shares were bought for 1,845,840 at an average price of 1.82. The total shares acquired in 2023 were 2,842,198 for 10,527,606 at an average price of $3.70.

During 2024, McLaughlin began adding more shares. January 2024, shares purchased were 237,532 for $418,471 for an average price of 1.76. February 2024, shares purchased were 182,941 for $290876 for an average price of 1.59. April 2024, shares bought were 1,016,612 for 1,545,595 at an average price of 1.52. The total number of shares purchased in 2024 was 1,437,085 for 2,254,942 for an average 2024 price of 1.57. 

So the total for 2023 and 2024 was 4,279,281 shares purchased at the cost of 12,782,548 for an average price of $2.99


The slide above was taken from Q4 2023 earnings call


Risk:

Customer activity is down, and management gave no guidance on revenue retention.
In Q4, the average paid membership dropped to 719,000, down from 732,000 in 2023. Expensify's new features took longer than expected, and Q1 2024 could be tough since January is traditionally a slow month, as discussed on the Q4 earnings call. 

Competition is intense with many private companies.


Capital structure: Expensify has three stock classes. Class A stock has one vote per share; privately held LT10 shares of 7.3 million (ten votes per share); and privately held LT50 shares of 7.3 million (50 votes per share). The owners of the LT10 and LT50 shares control 17% of the economic interest and 86% of the voting power in Expensify.

The CEO is betting on viral and SEO strategies for sales/marketing. These have execution risks. A weak economic outlook for existing customers could again be blamed for consistently missing expectations.

Cost cutting is responsible for the dramatic Q4 improvements over Q3, not operational or top-line improvements. On the recent Q4 earnings call, management didn't provide long-term growth guidance outside FCF for 2024.


Conclusion:

I'm optimistic about $ EXFY's long-term value based on the product's customer reviews, talented management/board, and a founding CEO's focus on the long term. Furthermore, the deep value is based on sales and FCF to EV for a SaaS microcap. Also, the low public float and tiny institutional ownership will quickly increase the stock price if they beat expectations or show customer growth.


Long: EXFY

3/25/2024

TANDY LEATHER FACTORY (TLF): Intrinsic Value Discount.

Tandy Leather, symbol TLF, founded in 1919, is a consistently profitable leather crafting retail leader. Tandy sells leather and leather craft-related items primarily through retail stores, websites, or direct account representatives. Tandy has 101 stores in 40 states, six provinces in Canada, and one store in Spain. Several smaller, privately family owned competitors exist, including Double Eagle Leathersmith, Montana Leather Company, and Weaver Leather Supply.


The table above illustrates a few of Tandy's unique values and attributes. Such as EV/OI = 8.8, P/NCAV = 1.13, and 85.50M cumulative EBIT over the prior 15 years and 121.28M for EBITDA. This is versus an enterprise value of 39M. 


Opportunity:

Tandy Leather reported fourth-quarter and year-end 2023 results on 03/22/24.  For the year ending 2023, Tandy shows continued profit growth and cash in a difficult retail environment with high inflation. Net income was $3.80 million, an increase of $1.20 million compared to the year ending 2022. Gross profit was relatively flat as margins improved from 57.90% in 2022 to 59.30% in 2023. Operating expenses declined 9.70% to a stable operating expense of 40 million. Cash grew to 12.20 million from 8 million in 2022. After adjusting for stock compensation, EBITDA was 6.50 million.

TLF is an intrinsically and relatively cheap investment based on consistent profitable FCF and growing margins. Deep value-based and long term owners provide a margin of safety and offer constructive activism. Bandera (Jeff Gramm) owns 34.40%, JCP Investment(James Pappas) 10.04%, and First Foundation (Eric Speron )10%. CEO Janet Carr owns 4.50%.

Over the past two years, investors have overlooked hidden value creation, including implementing new systems, shuttering unprofitable stores, and improving online distribution processes. Additionally, optionality exists as their fully owned corporate headquarters has been listed with a broker for sale. A +12 million net profit is a reasonable expectation if they sell. The sale of their headquarters will likely increase the price per share after a special or continued commitment to dividends. 

On a relative valuation basis, only 33 industry specialty retailers reported positive EBITDA out of 47 USA-headquartered companies. The industry average EV/Revenue was 1.92 versus TLF's .49. And an average EV/EBITDA was 52.46 versus TLF's 5.15.

Positive Yelp reviews


The picture above is from a Yelp review (Carol I from San Antonio, TX): "Staff has always been friendly and helpful the couple of times I've stopped in.".

"Great customer service, they even gave me a demonstration on how to use the splitter I bought." Johnny G.San Antonio,

"Amazing customer service, …was patient and helped me to understand all the necessities in order start this project." Ashley P. Austin, TX

"Definitely 5 stars. I have used this store 2 times once in person 1 time on the phone. The people here are GREAT!" Kenneth S.San Francisco, CA


Tandy operations have favorable unit economics and the resources to grow. Return on investment after opening a retail store in a few years with a cheap lease off the main strip and $200K in inventory.


Catalysts:

Sale of corporate headquarters now listed or secure a loan on the debt free headquarters worth ~ +15M to initiate a dividend.

Continued profitable cash accumulation with the market shift towards buying smaller profitable companies. 

RE per share increased 12.30% from the year ending 2021 to MRQ versus an EV per share decline of -19.22%. Tandy generated 35.61 million in FCF in the last fifteen years and 22.40 million in the last ten years.

A tiny 40% of the shares outstanding are in the float. 

Activist shareholders could force a sale, go private, or other strategic alternatives. Bandera (Jeff Gramm) owns 34% of the shares outstanding and is Chairman of the Board and a proven capital allocator with an average purchase price of 7.03. JCP (James Pappas) (Outside Director) owns 10.40% at an average price of $4.67/Share. FIRST FOUNDATION ADVISORS (Eric Speron) Average Price $4.69/Share. First Foundation (Eric Speron) Total Return Fund Average Price $4.82/share director of Compensation Committee. CEO (Inside Director) Janett Carr owns 4.40%.


Risks:
Continued inflation and weaker retail environment.


Conclusion:
Strong financials, debt-free, consistently profitable free cash flow, and a margin of safety. The company is undervalued based on its consistent FCF (free cash flow) and unlocked real estate value. Additionally, the CEO and board are incentivized with skin in the game with stock purchases above the current price. 


Long TLF


3/10/2024

Illiquid SPECULATION; Karnalyte Resources (KRN.TO / KRLTF)

Karnalyte Resources (KRN.TO / KRLTF) was founded in 2007 and listed on the Toronto Stock Exchange in December 2010. The $65-million IPO raised $14 million more than expected.

KRLTF : Price = .15, market cap = 9.86M, enterprise value = 7.47M as of 03/11/24

Based on the 2016 National Instrument 43-101 Technical Report filed at sedar.com their Wynyard Project is projected to mine 2.125 million tons of potash annually. Additionally, a nitrogen project exists. Approximately 700 metric tons of ammonia and 1,200 metric tons of urea per day can be produced. Nitrogen's target customer is independent fertilizer wholesalers in Central Saskatchewan. The 43-101 report covers geology, mining, recovery methods, required infrastructure, mineral resources, and mineral reserves estimations.

Further, Fortune India 500 Gujarat State Fertilizers & Chemicals (GSFC) is Karnalyte's largest shareholder. As of 2024, GFSC still supports Wynyard Potash and Proteus Nitrogen projects. Gujarat State Fertilizers & Chemicals has contractually guaranteed a long term availability to purchase Karnalyte's potash. Detailed engineering has been completed, and all environmental permits remain valid. Funding and market conditions determine Karnalyte's progress.

Karnalyte Resources' investment potential is impressive.

Karnalyte's largest shareholder is Indian agribusiness giant Gujarat State Fertilizers & Chemicals (GSFC). A placement happened in January 2013 for 8.15 Canadian Dollars per share. Karnalyte's current enterprise value is 5.74M, and its market cap is 7.51 M. This compares favorably to the 19.80% ownership or a 40 million GFSC 2013 investment. 

Additional evidence of GSFC's commitment was participation in the rights offering on August 3, 2022. In this offering, GSFC acquired an additional 9,100,000 shares at $0.35 each. GSFC owned 38.73% before the offering, but ownership is now 47.73% with this purchase. This strategic move boosted Karnalyte's capital by $3.862 million. The additional investment allowed GFSC to increase its board representation.


Potential valuation:

In June 2016, Karnalyte received the National Instrument 43-101 Technical Report for its Wynyard Potash Project. The report verified a staggering amount of mineral assets. 

Potash Project (Bankable Feasibility Study in Canadian dollars)

“NPV (8% ) $3.39 Billion for all 3 phases (after tax), IRR 19.1% for 3 Phases, 2.125 million tpy project (after tax), CAPEX for Phase 1 $789 Million ($2.396 Billion for all 3 phases) Cost per installed tonne of Capacity $1,262 for Phase 1 ($1127 for all 3 phases)Proven & Probable Reserves of 147 million tonnes KCl, Estimated Mine Life over 70 years for 3 Phases, 2.125 million tpy project

Magnesium Project (Preliminary Feasibility Study)

"Considers annual production of 100,000 tonnes of MgCl2 brine and 104,000 tonnes of 99+% Hydromagnesite (BMC). Construction assumed after phase 1 of potash)"

"NPV (10%) $512 Million (after tax), IRR 26.1% (after tax),CAPEX (additional to Phase 1) $171 million,OPEX for MgCl2 Brine $7.01 per tonne,OPEX for Hydromagnesite $302.01 per tonne,Probable Reserves for MgCl2 694.6 million tonnes of carnallitite @ 22.1% MgCl2, equivalent to 153.3 million tonnes “mineable” and 7.9 million tonnes of product"

Click here to review the National Instrument 43-101 Technical Report. The 43-101 report details property data verification, metallurgical testing, mineral resource/reserve estimates, recovery methods, market studies/contracts, capital/operating costs, and economic analysis.


Karnalyte's mineral assets have staggering potential. There is a possibility of billions in potash and magnesium before operation costs. "There's enough potash there to sustain the world for I don't know how many years," said Dave Van Dam, a prominent Kenora businessman and Karnalyte shareholder. "It's monstrous."

A Karnalyte board meeting was scheduled for November 2003 in Saskatoon, Canada. However, GFSC's executives abruptly canceled their flights from India over the government's public disagreement with the killing of a Sikh leader on Canadian soil. KRN's board has two Indian executives from GFSC and one Indian banker.

 "We were preparing to welcome our board colleagues from India for a visit to Canada this week. However, they canceled their trip due to tensions that arose and escalated last week," Karnalyte's Interim Chief Executive Officer Danielle Favreau said in an email. "We hope to reschedule their visit soon." 

Karnalyte's chairman is Vishvesh Nanavaty, Gujarat State Fertilizer's (GFSC) chief financial officer. Director Dilip Pathakjee is a senior vice president at GFSC. Another board member is Indian international banker D.C. Anjaria.GFSC is financially committed and counting on future potash supplies despite recent diplomatic disagreements over Sikh Nijjar's slaying.

As of June 30, 2023, Karnalyte has zero debt and $2.7 million in cash and net working capital.


Opportunities:

In March 2016, Karnalyte Resources announced a deal with GSFC to finance the construction of its 625,000 tons per year potash mine in Wynyard, Saskatchewan. Besides that, Karnalyte plans to spin off its secondary mineral assets and unexplored lands into separate companies so shareholders can profit. The GFSC partnership aims to finance Phase 1 of the potash mine while leveraging Karnalyte's non-potash assets.

Unfortunately, the 2016 $700 million financing deal failed. The negotiations ended without agreeing on the governance issues and the terms for spinning out Karnalyte's secondary minerals, including magnesium into a separate entity. Further, KRN did not agree to give up 51% of the voting power to GFSC.

Tiny Insider buys from board member Ritu Malhotra 51,000 shares for .19 on 07/20/23.

As of June 30, 2023, the company had $2.7 million in cash and positive net working capital of $2.7 million, with no debt. No debt eliminates bankruptcy if short-term financing is needed next year.

Karnalyte is sitting on potash and magnesium resources that are worth billions before construction costs. 

Risk:

GFSC can hold up the project for years. And KRN likely needs cash around +1 years.

Illiquid

Need for financing.

Karnalyte (KRN.TO KRLTF) has been distracted by lawsuits alleging governance irregularities and improper lobbying.


Conclusion:

Karnalyte's investment thesis is simple. GFSC wants Karnalyte's Potash and Nitrogen assets. So, GFSC initiated a position in 2013 when it acquired 19.80% of Karnalyte's outstanding shares at 8.15 per share or 40 million Canadian dollars. GFSC's average cost exceeds the current market price of 7.50 million USD. GFSC now controls 47.73% after an August 2022 secondary offering.

GFSC's CFO, Vishvesh D. Nanavaty, is now Karnalyte's board chairman. Dilip V. Pathakjee (an Indian executive at GFSC) and D.C. Anjaria, an Indian banking executive, are also board members. Canadian business leader Ritu Malhotra is the latest board member. The board construction supports the thesis that GFSC will finance current operations as they attempted with a failed 2016 700M finance proposal.

The 700M USD 2016 financing agreement fell through because GFSC wanted 51% of KRN and access to a spin-off of their nitrogen assets. This disagreement is likely resolved. 

The technical report demonstrates billions of dollars worth of assets before construction costs. Detailed engineering has been completed, and all environmental permits remain valid. Funding and market conditions determine Karnalyte's progress. KRN is not a venture-listed company but instead listed on the Toronto exchange, Big Four auditor (KPMG), and is currently working with UK global consulting and engineering company Wood PLC to evaluate additional cost savings on an ongoing basis to ensure maximum value for investors.

GFSC didn't spend ~$45 million without seeing its investment return in potash and minerals or serving on the KRN board. The sleeping giant KRN has a possible billion dollars of assets supported by the National Instrument 43-101 Technical Report. And $100 million had already been invested in the project.


Karnalyte is SPECULATIVE!!

 Although the current attributes compare favorably to KRLTF's current price = .15, market cap = 9.86M, and enterprise value = 7.47M


Catalyst: Financing

Long KRN.TO KRLTF

10/23/2023

Joint Corp (JYNT): From Growth to Deep Value

 Description:

The Joint Corporation (JYNT) is the largest domestic franchisor and operator of chiropractic clinics. The company aims to provide affordable chiropractic services in this fragmented market using a private pay, noninsurance, cash model. Joint has 900 locations in the USA and plans to open 100-120 newly franchised clinics in 2023.

Overview:

With double-digit top line growth, Joint is also undergoing financial and strategic changes. As the largest chiropractic provider, it's positioned to capture a significant share of this fragmented market. A strong investable opportunity exists due to dramatic oversold conditions, financial improvements, and operational flexibility. Management is committed to selling nonperforming assets, franchising, and reducing expenses.

The valuation has materially improved, mainly driven by JYNT's drop in market value. This price decline is in the face of consistent double digit top line growth. This progress and a decline in the company's market value creates an investable opportunity. Many low hanging operational levers remain to enhance shareholder value.

A closer look at Q2 2023 reported in September.


In Q2 2023, The Joint Chiropractic revenue grew double digit. Yet, management recognizes they needed to make operational changes. To partially address these concerns, Lori Abou Habib was appointed to lead marketing.

 Joint Chiropractic focuses on short appointments and affordability. This distinct approach attracts new patients. They also emphasize providing treatments like standard adjustments rather than complex clinical diagnoses. And they don't accept insurance.


While JYNT is making internal changes. External accolades from reputable franchise publications and rankings affirm its strong market position. JYNT's mix of operational flexibility and market recognition suggests undervaluation.

Preliminary revenue for Q2 2023 increased by 18% compared to the prior year quarter. Growth improved performance in franchised and company owned clinics. Company owned clinics (+23%) and franchise operations (+11%) drove the revenue increase. Preliminary adjusted EBITDA reached $3.2 million, a 23% increase over the same period last year. Cost control measures such as a hiring freeze, reduced travel expenses and canceled nonessential projects were implemented. Further, the divestiture of specific corporate clinics optimizes productivity and reduces SGA. The financial guidance for 2023 has been revised downward due to changes in accounting, divestiture plans, and economic factors. A renewed focus on cost reduction helps prepare for economic uncertainty and lower revenue expectations.

Clinics had a negative 1% decline in sales for clinics operating beyond 48 months. Management expects these challenges to persist in the second half, but options exist to counter them. Their key metrics - new patient count, conversion rates, and attrition - show promise, with attrition and conversion improving. However, their new patient count is slowing. To address this, Lori oversees their marketing efforts, focusing on two key sources of new patients: referrals and local marketing initiatives. 30% of new patients come from referrals. Their clinics cater to those within a 5- to 15-minute radius, and they must educate this local audience about their services. Through traditional means like coupon outreach to schools and gyms.

In summary, The Joint faces challenges but is working to overcome them.


Opportunities:


The Joint faces internal (underperforming owned locations) and external challenges (economic/ inflation). But the market undervalues their growth, unique niche, flexibility, operational leverage, financial stability, and mean reversion.

The company is transitioning and adjusting its strategy on a large book of business of 111.74M in revenues for the trailing twelve months.  Lori Abou Habib was appointed Chief Marketing Officer. Prior to this, she worked at the SONIC Drive-In Franchise Brand. Her franchising expertise complements the refined strategy.

The Joint Chiropractic moved up to 52nd on Entrepreneur Magazine's 2023 Franchise 500 from 57th in 2022. This ranking evaluates cost, growth, and brand strength. The Joint is recognized by Forbes, Fortune, and Franchise Times for its growth and approach. In 2023, it was 18th on Franchise Times' Fast & Serious list. The Joint was also 1st on Forbes' 2022 Best Small Companies, 3rd on Fortune's Fastest-Growing Companies, and consistently ranks high on franchise lists. In 2023, it was named a Top Franchise by Franchise Business Review and was in their 2022 Most Profitable Franchises report.

Operating leverage is powerful with little or no costs for each new patient.

Aggressive insider buying from Bandera. In 2023, Bandera purchased 1,472,047 shares for $15,476,620 at an average cost of $10.51 per share. In total, Bandera owns 3,937,296 shares, or 26.69% of shares outstanding or 37.28% of float.

Mean reverting attributes such as a decline of -86% in EV per share from year end 2021 to today.

Valuation ratios have improved significantly. EV/Revenue at 1.26 improved 89% from 2021 amount of 11.89. The Price/ Operating cash flow is 7.72, an improvement from the 70.86 balance for 2021.
 

F score of 8 is a historical high. An increase in the following drove the F score of 8. Positive change in ROA, cash flow return on assets (CFROA) > ROA, positive change in return on assets, cash flow return on assets greater than the return on assets, positive change in working capital ratio, increase in gross margins, positive change in asset turnover. Two points were lost on the F score due to a slight increase in shares outstanding, and a long term debt to average total assets increase.

Opportunities for cost reduction. Hiring freezes, selling/closing corporate own locations, reduced travel expenses, and canceled non-essential projects will positively impact the bottom line. These steps are vital in curbing general administrative expenses. SGA per share increased 47.37% from 6.36 for the TTM versus 4.32 for 2021.


The Joint is transitioning toward an asset light franchise model. Asset depreciation and cost inflation will improve after the sale or closing of nonperforming corporate owned locations. 


Risks:

Several factors drive investor's concern and has a significant short position at 6.26% of the float. In 2021 and 2022, the Joint had to restate its financial statements. And reported a material weakness in their internal controls. Further, implementing updated accounting methods may impact reported earnings. The accounting change is tied to the reacquisition of regional developer rights and transfer pricing. Also, there are concerns about the saturation of JYNT's clinics in certain areas.

Competitors might replicate JYNT's business model. However, JYNT doesn't compete with regional or national entities. A short report forecasted a decrease in the company's stock price. This report negatively influenced the stock price. However, the short report has been challenged as misleading. 

Skepticism about chiropractic care may contribute to unfavorable stock valuations. There are concerns about new market entrants and regulatory changes.

Compared to prior years, stock compensation has grown 23% from 2021, and financial liquidity using the quick ratio declined 28% from 1.37 in 2021 to current balance of .90. SGA per share grew +47.37% from 2021 to TTM versus revenue per share improvement of +40%. 


JYNT has a promising model. However, increased competition is real if other chiropractors adopt the same business model.


Valuation.

A valuation analysis can help determine JYNT's expected price by analyzing its intrinsic, relative, and historical value.

I used a DCF to calculate intrinsic value. It shows a market price slightly above the estimated intrinsic value using historical earnings. But the current market value is significantly discounted if we use average earnings from 2019 to 2021. Also, using free cash flow for a DCF shows a discounted market price to its intrinsic value. Historical earnings have not been consistent or predictable. This lowers the intrinsic estimate compared to using relative and historical valuations.

Earnings Power Value (EPV) exceeds the current price. EPV uses current earnings without considering growth. The assumption is the business will maintain its earnings forever, with no growth/change.

Using historical multiples like P/E, P/B, P/FCF, P/S, coupled with consistent double digit growth shows JYNT market price trades at a material discount.

I believe JYNT's stock price is trading below its fair market value. For me, this high risk stock is a buy.  However, I will add on weakness given the economic challenges and operational changes. Because in the next six months, we won't see the full benefits of their operational changes.
 

Conclusion:

The Joint Corporation is the largest domestic chiropractic clinic franchisor. JYNT is a risky stock. But, with double digit consistent top line growth, near profitability, and financial stability, the stock is a buy after the irrational 86% decline in EV per share from 2021.Along with that market decline, revenue per share grew 40% from 2021 and 86.38% from 2020. Further, valuation ratios are at historical lows and relatively cheap. Entrepreneur Magazine's rankings and accolades from Forbes, Fortune, and Franchise Times have recognized the Joint's accomplishments.

With aggressive buying from Bandera, cost cutting measures and growth, their future looks promising.

Don't forget JYNT is a high-risk stock. Past financial restatements for 2021 and 2020, local market saturation, and weakening financial position present risks. However, the company's move towards an asset light franchise business model underscores its optionality. While valuation analysis suggests JYNT is undervalued, the full benefits of their recent changes and changes over the next quarter will likely be more visible in the longer term. JYNT is a potentially rewarding investment opportunity.


Supporting data: