ShadowStock ... Deep Value, Contrarian Investing
"There Are No Bad Assets Just Bad Prices." Exploiting Market Anomalies with Neglected Data
Pages
Home
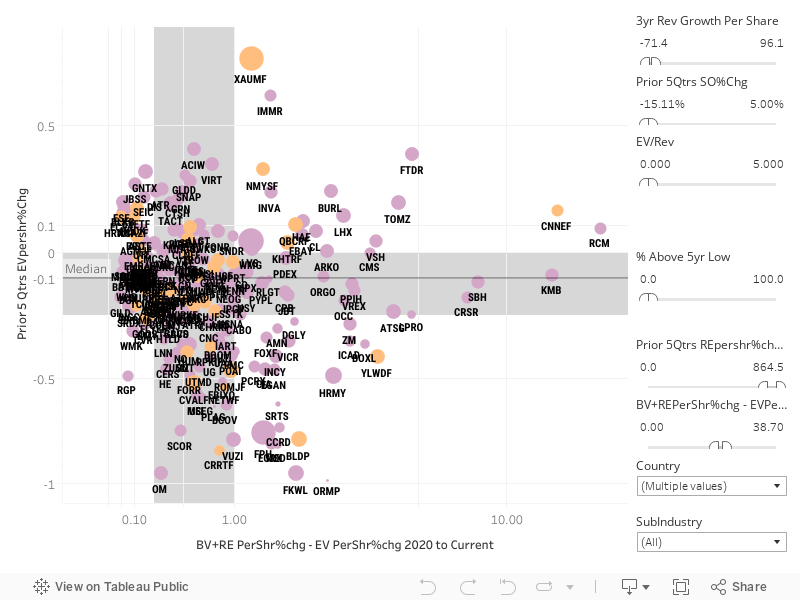
Discovery: BV and RE per share versus EV change
Scatter Plot Dynamic X and Y Axis
Discovery: BV and RE per share versus EV change
Legend:
Color = County, Sector = Shape, Size = 1yrRevGrowthRate
Use the right-side filters to change the number of stocks. Export to Excel or include or exclude selections by lassoing stocks.
Home
Subscribe to:
Posts (Atom)